Focus -- concentration or dispersed -- in streams of Twitter messages
The goal is being able to characterize streams of messages. A simple characterization is the percentage of the messages that are retweets. That is not a property of the individual tweet. It is not a property of the person who writes the message. It is a property of the stream.
How is characterizing streams worthwhile? There is a stream of messages posted to Twitter for every State of the Union Address. Twitter is the fastest growing social media, and the number of messages about the address grows exponentially from year to year. In 2013 there were, according to Twitter, more than 1.36 million messages about the State of the Union Address (Twitter Blog, 2/12/2013) They also show the high points of messaging during the address. What they do not say is the way in which the message stream changes from before to during to after. If you look at the incidence of retweets and urls in the stream you find that retweets and urls are found in a substantial percentage of the messages, but during the address both drop significantly though urls drop more than do retweets. The number of messages does not drop, but they have become focused on the address and reacting to the address. They are no longer referring to external communications which is the point of the urls. They are responding to the President and the members of congress in the room rather than to each other. The communication changes. What people are writing changes from before to during to after, and it is possible to track that systematically (Boynton, 2011) The stream changes and we are able to understand how the communication changes by characterizing the stream.
I have tracked the use of retweets, hashtags and urls on a number of occasions. But that does not get at how focused the stream is. Is there one subject dominating the communication or many? What if the search term used to collect Twitter messages was Obama? On any day there are many things one might want to say about Obama so one would expect a stream that was not concentrated -- except on the day of the election, for example. A collection using the search term #OccupyWallStreet under some circumstances might be very narrowly focused -- for example the afternoon they marched across Brooklyn bridge -- but not so narrowly focused -- for example as the number of occupy locations grew with communication about each.
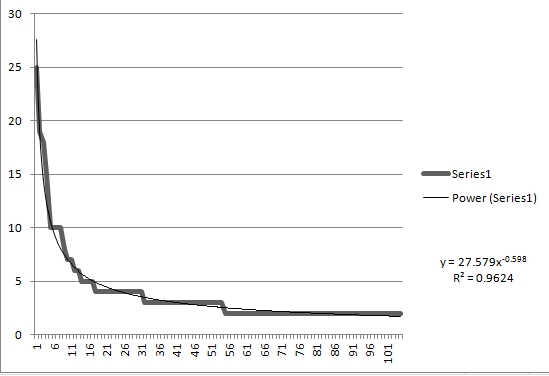
A first approximation is to show the concentration of retweets. Messages that are retweeted are prominent in most of the streams of messages I capture; they range from roughly 50% to about 70% of the tweets. It is relatively easy to count the number of retweets per message so one can look at the distribution or retweets per message from many retweets to few retweets. The figure gives an example.
|
This was a search specifically for this analysis. The search term was Obama. I captured just under 1,500 tweets in the early evening of 3/25/2013. Fifty-two percent of the messages were retweets or the original message retweeted. The figure shows that the message retweeted the most often was retweeted 25 times. And two is the minimum for original message and a retweet. So the range in this case was 25 to 2. That curve looks like it would be appropriately described by a power law function. A power law is scale independent so the relevant number for interpretation is the exponent. In this case the exponent is 0.598. The fit is quite good -- both visually and with an R square of 0.96. A famous power law distribution is Pareto's 80/20 distribution. It is a distribution in which the top 20% of units have 80% of the total. In this case it would mean that the 20% most frequently retweeted messages would be 80% of the total retweets. However, the top 20% have only 47% of the total retweets. The exponent of 0.598 captures the concentration in a single number. The smaller the exponent the less the concentration. The larger the exponent the greater the concentration. On the 25th there were many things to say about Obama, and the concentration of the messages posted to Twitter was modest.
I wanted to look at a stream that should be substantially more focused than the Obama stream. There are days on which high profile events occur, and one would expect the focus to be more concentrated. On the first day the Supreme Court heard oral arguments about same sex marriages there was a very large outpouring of Twitter messages. I collected a stream of just under 1,500 tweets using the search term "same search marriage." That search found 87 messages retweeted one or more times producing 805 retweets. A high profile event like this will generally produce a very concentrated stream of messages.
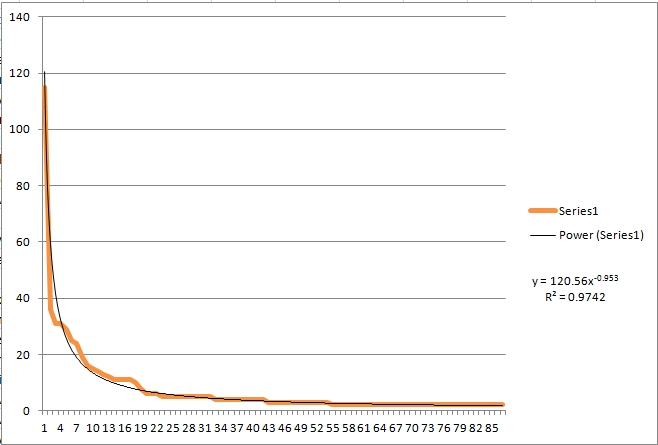 |
The orange line is the plot of the number of retweets and the black line is the power law fitted to the empirical distribution. The fit is again very good with an R square of .97. And the exponent is much larger at .953 compared to .598 for the Obama stream. This is a more concentrated stream. You get the same conclusion by looking at the percentage of the total retweets in the top 20%, which was 65%. It is still short of the Pareto 80/20 distribution, but it is much more concentrated than the stream of messages mentioning Obama.
I collected or assembled 47 data collections. The search terms are listed below. For each I extracted the retweets and computed the power law exponent and the percentage of the total in the 20% of messages most frequently retweeted. The figure shows the joint distribution.
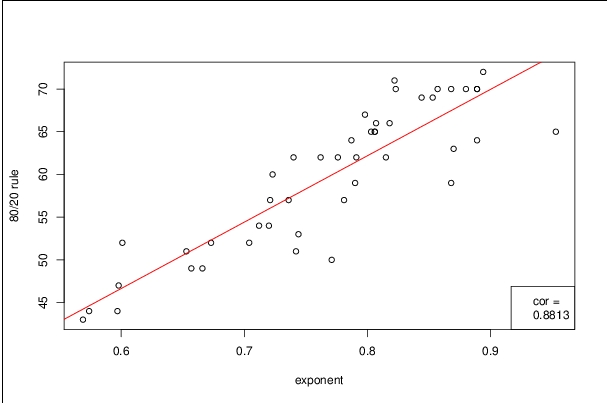 |
I used a rank order correlation, Spearman rho, to summarize the joint distribution. It was .88, and visual inspection suggests there are only a few that are at considerable distance from the line. The percentage of total tweets found in the top 20% of messages retweeted is a crude indicator of concentration, but it seems to be strongly correlated with the exponent of the power law function.
What prompted this search for a way to summarize concentration of focus was thinking about the messages of the Occupy movement. At the initial point of 'take off' the retweeting was unusually high. The table presents the percentage of all messages captured when searching for #OccupyWallStreet that were retweets September 29 through October 8 of 2011.
9/29 |
9/30 |
10/1 |
10/2 |
10/3 |
10/4 |
10/5 |
10/6 |
10/7 |
10/8 |
65.6% |
64.3% |
69.8% |
65.0% |
59.5% |
58.2% |
63.9% |
55.8% |
57.0% |
58.1% |
I have argued that this is often, though not always, associated with constituting a we to stand over against the other. In this case the other being the world financial industry symbolized by 'Wall Street'. (Boynton, 10/9/2011 and Boynton, 3/1/2013) It is instructive that the highest percentage is October 1 because that was the day they marched across Brooklyn Bridge and many were arrested. It was the signal event establishing the Occupy movement as a global movement. But every retweeted message could be retweeted the same number of times as every other for a completely flat distribution. In that case making a claim of concentration of focus would seem odd. So I need a procedure for computing concentration and enough comparisons to other streams of messages so that I can confidently claim that the computed numbers are 'high.'
9/29 |
9/30 |
10/1 |
10/2 |
10/3 |
10/4 |
10/5 |
10/6 |
10/7 |
10/8 |
.844 |
.868 |
.889 |
.857 |
.853 |
.823 |
.880 |
.818 |
.803 |
.787 |
This table gives the exponents for the power law calculation for September 29 through October 8. They are relatively high. For the 47 collections I analyzed the range was from .569 to .953. Only one, tweets about same sex marriage the day the Supreme Court heard arguments about that, was above .9. Twenty exponents were .8 or above, and of those 13 were analyses of streams of Occupy messages. Only two Occupy streams were less than .8. The one for 10/8 which is .787 and the one for 10/9 which is .776.
Conclusion/limitations
First, I should note that in each collection there is considerable commonality. They all were found because the search term was included in the message. So the variety in the distribution is limited by this common element. That, however, is true of all of the power law applications I know about. When you calculate a power law on city size you assume cities. They are all cities by some other specification and it is only the distribution of size that is being examined.
The 'other specification' for me is the search term. But the specification of how one retweeted message is different from another is taken for granted here. If you have two cities with overlapping occupancy spaces the government specified boundary might well be thought of as arbritary. Similarly individual retweeted messages may be very similar. Differentiating them may equally be thought of as arbitrary. The power law is not going to help with the specification of difference.
I used Excel to calculate the power law. It uses a maximum likelihood approach that involves fitting a polynomial of a constrained sort to the data. It does not use the log-log transformation that seems to be more common. I am not an expert, but I have found references that say this is a superior procedure. The procedure is readily available in Excel, and it may have strengths that other procedures do not have. (Goldstein, et al, 2004 and Clauset et al, 2013)
Computer scientists so regularly find power law distributions in Twitter streams that they no longer think of that as very interesting. This assertion is based on talking with computer scientists rather than published statements. But I believe this provides a procedure for answering a question for which I have no other systematic procedure. 'Old hat' has meaning because it is useful here as in many other disciplines.
References
Boynton, G. R. (3/1/2013) A Moment in the Constitution of Social Movements
Boynton, G. R. (10/9/2011) Noticing Identity in Social Movements -- #OccupyWallStreet
Boynton, G. R. (2011) The State of the Union Address -- It's a happening
Clauset, Aaron and Cosma Rohilla Shalizi and M.E.J. Newman (2013) Power-Law Distributions in Empirical Data (cited 1697 times)
Goldstein, Michael L. and Steven A. Morris and Gary G. Yen (2004) Problems with Fitting ot the Power-Law Distribution (cited 366 times)
Twitter Blog (2/12/2013) 2013 State of the Union Address
Search Terms
The numbers in parenthesis give the number of searches for the search term. The ones with six searches were made specifically for this comparison. I wanted to be able to assess the stability of the computations since I had so many searches over time for OccupyWallStreet.
© G. R. Boynton, 3/30/2013