The highpoint of global communication as Egyptians struggle
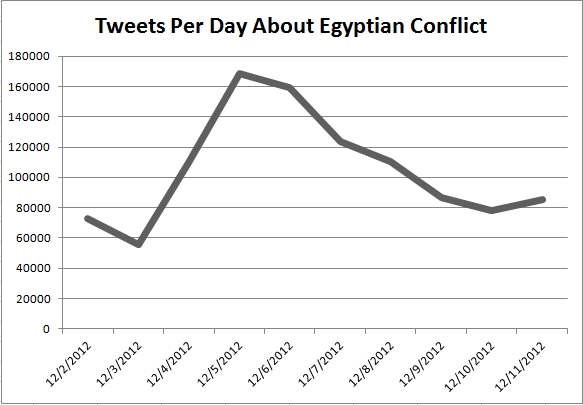
The constitution writers produced a document. The judges declared they would no longer serve the state on December 2. And conflict on the ground revved up. That produced the spike in the figure below.
|
For the ten days the total was 1,051,109 messages posted to Twitter that mentioned either Morsi or Egypt or Tahrir or 25Jan or MuslimBrotherhood for an average of 100,000 messages a day. Not all days were equal, of course. December 4 through 8 was a peak with more than 100,000 messages a day. Before and after the number of messages was in the 80,000 range. The conflict in Egypt reached a new point as they gathered outside the president's palace on December 4. And the intensity of the local conflict triggered a spike in messages from Egypt and the world.
The analysis of the location of users posting messages to Twitter is divided into two five day periods to check for changes over the period.
Dec 2 through Dec 6 |
Dec 7 through Dec 11 |
|
| Total messages posted | 566,303 |
484,806 |
| Number users posting | 129,505 |
137,959 |
| Mean posts per user | 4.37
|
3.51 |
There were more messages posted to Twitter in the first five days, and they were posted by a smaller number of users than in the second five days. There is more intense communication in the first five days than in the second. The users posting messages were doing it very repeatedly. However, this is intense communication in both cases. It can be compared to other data I am collecting. These are again five day averages. So they are directly comparable to the five days here.
| #p2 | #tcot | #teaparty | #wiunion | barackobama | Palin | Romney | Ron Paul | RT @moveon | RT @nytimes | RT @thinkprogress |
2.12 |
2.07 |
2.48 |
2.84 |
1.38 |
1.34 |
1.14 |
1.63 |
1.15 |
1.14 |
1.32 |
The highest average is 2.84, which is substantially lower than either of the two streams about Egypt. The first four are political dispositions: #p2 is the progressive focus, #tcot and #teaparty are conservative focii, and #wiunion is the revolt against the governor in Wisconsin. They are the only streams that averaged as much as two messages for the five days. The streams of messages mentioning the four political figures are closer to one than to two. And the three streams retweeting posts from news organizations are even closer to one.
What is happening in the stream of messages about Egypt is not standard operating procedure.
The regions of the users posting messages in displayed in the next table.
Region |
Users Dec 2-6 |
Users Dec 7-11 |
Ratio |
| US & Canada | 56,371 |
57,358 |
1.02 |
| Middle East | 24,563 |
27,987 |
1.14 |
| European Union | 21,189 |
22,823 |
1.08 |
| South America | 9,488 |
10,343 |
1.09 |
| Greenland | 6,061 |
7,302 |
1.20 |
| South Asia | 3,639 |
3,819 |
1.05 |
| Far East | 2,117 |
2,181 |
1.03 |
| Africa | 2,137 |
2,136 |
0.99 |
| Australia | 960 |
976 |
1.02 |
| Ex Soviet | 506 |
575 |
1.13 |
| Other | 2,478 |
2,468 |
0.99 |
| Total | 129,505 |
137,959 |
1.07 |
The US and Canada are combined because Twitter uses the time zones that incorporate both. In other research Canada was between 10% and 15% the size of the US.
The US and Canada provide just over 40% of the users posting messages to Twitter about the Egyptian conflict. This is a bit lower than the standard 50% for the US alone. The Middle East nations and the nations of the European Union rank second and third in terms of number of users. The numbers fall off very sharply after that. The nations of South America have the next largest number of users and the Ex Soviet nations have the fewest.
The stability between the two time periods is notable. Greenland has the largest increase in users with 1.2 times as many in the second five days. The Middle East is next in increase with the second five days being 1.14 times the first five days. The US and Canada, the Far East, and Australia are very close to the same for the two periods. And Africa and Other are almost exactly the same.
The data collection did not include the language of the tweets. To estimate the distribution of language I collected estimates of language use every four hours from December 8 through December 12. The program collected 1,000 tweets when the search was for Morsi, 1,000 when the search was for Egypt, and 1,000 when the search was for Tahrir. That meant three data collections six times a day or 18,000 tweets per day for four days. The total was just over 70 thousand messages posted to Twitter using one of the three search terms. The languages collected were English, Arabic, and other. Other was a small category with Indonesian and Spanish being the only languages that were found with any regularity.
The table lists the mean number of times each of the three language categories was present over the 24 searches.
Morsi |
Egypt |
Tharir |
||||||
English |
Arabic |
Other |
English |
Arabic |
Other |
Engilsh |
Arabic |
Other |
672 |
160 |
112 |
561 |
356 |
25 |
266 |
592 |
86 |
When the search term was Morsi 67% of the messages were in English and only 16% were in Arabic. When the search term was Egypt the number in English was a bit lower and the number in Arabic was greater. It is only when the search term was Tahrir that the number of Arabic messages outnumbered the English messages.
How the differences in the search terms makes a difference depends on the quantity of messages associated with each. Morsi and Egypt and Tahrir were search terms in the collection of messages about the conflict. The number of times each appeared in the collection is
Number Twitter messages |
English Dec 2-11 |
Arabic Dec 2-11 |
|
| Morsi | 291,702 |
195,444 |
46,672 |
| Egypt | 779,524 |
436,533 |
277,510 |
| Tahrir | 86,039 |
22,972 |
50,763 |
| Sum | 1,157,265 |
654,949 |
374,945 |
| Ratio to collection | 90.1% |
590,109 |
337,825 |
The total number of messages collected was 1.05 million. The total for the table is 1.16 million. There was some duplication, but the duplication was not as great as one might have expected. The users were using just over one term per message. If the columns for English and Arabic are summed and adjusted to be the appropriate size you get 590 thousand in English and 338 thousand in Arabic. English is just over double the Arabic. And that suggests that messages in Arabic are coming from regions in addition to the Middle East region.
Global communication: There are two indications of the global character of the communication. One, users were posting from all over the world. The regions of the world were not equally represented, but almost everywhere had a piece of the action. The second indication is the language distribution. Arabic was used more frequently than can be accounted for by users from the Middle East. Arabic, like English, is becoming a global language as the reach of messaging becomes global.
Global Communication: Recapitulation
These are explorations in global communication via Twitter. I want to assemble earlier results here for comparison.
The messaging about Egypt beginning with November 23 and running through December 1 saw much greater increases in the number of users
Region |
Nov. 23 & 24 |
Nov 25 to Dec 1 |
Total Nov 23 to Dec 1 |
Increase |
| Jakarta | 121 |
436 |
557 |
3.6 |
| Middle East | 4164 |
8013 |
12177 |
1.92 |
| Kuala Lumpur | 204 |
369 |
573 |
1.81 |
| Greenland | 1270 |
2285 |
3555 |
1.80 |
| European Union | 4053 |
6814 |
10867 |
1.68 |
| Australia | 179 |
279 |
458 |
1.55 |
| South America | 917 |
1282 |
2199 |
1.39 |
| United States | 7810 |
10282 |
18092 |
1.32 |
| Totals | 18718 |
29760 |
48478 |
1.59 |
Ten days in November -- Barack Obama is re-elected
| Nov 1 | Nov 2 | Nov 3 | Nov 4 | Nov 65 | Nov 6 | Nov 7 | Nov 8 | Nov 9 | Nov 10 | |
| Total | 215,856 |
230,633 |
194,577 |
270,434 |
376,307 |
672,952 |
657,675 |
360,586 |
269,090 |
293,863 |
| % not US | 41.8% |
35.1% |
40.0% |
28.1% |
45.5% |
45.5% |
53.6% |
58.2% |
46.4% |
37.7% |
Between November 1, 2012 and November 10, 2012 I collected Twitter messages mentioning President Obama. The search terms were Obama, barackobama, and obama2012. Barackobama is the user name of the Twitter account the president has had at least since he was first elected. Obama2012 was the Twitter account specifically for the 2012 campaign. The collection accessed the Twitter streaming api which is, in principle, a one percent sample.
The table displays the number of user accounts found in the Twitter messages mentioning the president each day. These are not messages. They are the user accounts sending the messages. The distributions in the table show that a very substantial percentage of the people mentioning the president were from outside the United States. On November 7 and 8 more than 50% of the people posting messages congratulating the president were from locations outside the U.S.
Mr. Netanyahu -- the aftermath
Israel launched an attack on Hamas on November 16, 2012 and a cease fire agreement was reached on November 21. (Federman and Laub, 11/21/2012) I collected mentions of Prime Minister Netanyahu for the next two days. I wanted to look at global the communication about the war and cease fire. The search term was Netanyahu, and the collection ran the two days -- November 22 and 23. The collection totaled 11,805 Twitter messages mentioning Netanyahu. A total of 6,630 user accounts posted messges to Twitter.
A first look is at user accounts from the region.
Jerusalem |
Cairo |
Baghdad |
Abu Dhabi |
Riyadh |
Tehran |
Muscat |
116 |
59 |
50 |
37 |
36 |
29 |
2 |
The total from the region was only 346 out of the 6,630 users who posted a message to Twitter. And there are only a few from each Twitter time zone. Only 116 users in Jerusalem posted a message mentioning Netanyahu, and that was more than double most of the rest of the time zones in the region.
The U.S. and the E.U. dominated the Twitter communication.
US |
EU |
South America |
South Asia |
Far East |
Greenland |
2580 |
1193 |
907 |
682 |
354 |
193 |
The total for these regions is 5909, which is 89% of the total user accounts. The U.S. is the largest with 44% of the users in the six regions. Greenland is again a location of a number of active user accounts. The far east is again very low compared with other regions. And the nations of the former Soviet Union are hardly present.
© G. R. Boynton, 12/15/2012