Evoking Latent Dispositions: How Americans Came to Believe Obama Is a Muslim
G. R. Boynton
Caroline Tolbert
University of Iowa
"Obama is a muslim" is one of the odd refrains of contemporary American politics. During the campaign, March and October 2008, twelve percent of the public believed that Obama was a Muslim. After the election that rose to almost twenty percent.
March 2008 |
October 2008 |
March 2009 |
July 2010 |
Aug 2010 |
November |
|
| Believe is Muslim | 12% |
12% |
11% |
18% |
18% |
17% |
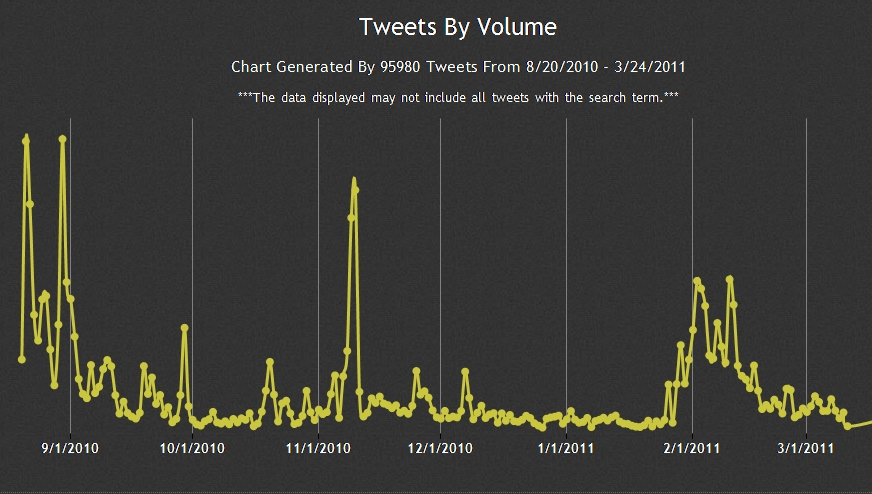
The distribution of Twitter messages about Obama being a Muslim has a rather different character.
|
The figure gives Twitter messages per day from August 20, 2010 through March 17, 2011. Two differences are apparent. One, data collection is more frequent. Surveys are expensive and time consuming. Twitter messages are cheap and easy to collect -- though the collection is not without its own problems. Two, there is much more varibility in this data than in the survey data.
We will use this element in contemporary American politics to illustrate how the two modes of observation -- by survey and by Twitter message collection -- complement and supplement each other to inprove our understanding.
Political scientists have been doing survey research since the middle of the twentieth century and Twitter is 'brand new' to the scene. We know the ins and outs of survey research. With Twitter our experience is much more limited. So we will start with Twitter, which needs greater explanation as a mode of observation than does survey research.
In March 2011 Twitter celebrated its fifth 'birthday.' It did not make much progress in 2006 until it took a meeting of communication technologists by storm at the 2007 SXSW. And it took two more years, fall of 2009, before people outside this very limited field found out about and started using Twitter. For the first time, in the fall of 2009, there were 50,000 Twitter messages a day. The growth rate has accelerated and Twitter announced at their birthday celebration that there are now 50 billion messages a week. They gained 100 million users in 2010 alone. It is a heavily used medium of social communication. Unlike Facebook, which has also been growing rapidly during this period, communication via Twitter is public by default. The 50 billion messages are extremely close to all being public messages. This is a major addition to the public domain. One way to put it is: move over mass media you no longer have a monopoly on the public domain; the people now have voice.
Messages do not come labelled political and not political. However, one can search by subject and determine the volume of the flow. In the spring of 2011: messages about #libya numbered 50,000 or more per day for several weeks; messages about #syria were in that range for days; and messages about the protest in Wisconsin, #wiunion, numbered 30 to 40 thousand a day for the first weeks of the protest [Boynton, 2011]. And for this research we collected 97,443 messages. There is, of course, politics that gets much less attention than these subjects. The Supreme Court's decision to review employer access to the messages of workers on company issued wireless phones drew only 461 Twitter messages. The range is very wide.
The Twitter messages we use were collected by searching for any Twitter message containing both Obama and Muslim beginning the morning of August 20, 2010 and every day after that through the middle of March 2011. The information we find is: a unique Twitter assigned number, the Twitter user name of the person sending the message, the date and time the message was sent, and the text of the message. The number of messages per day ranges from 5,000 to a few hundred. It did not take the world by storm like revolt in North Africa and the Middle East.
Observation: what we observe with both survey research and Twitter messages is an action in response to a triggering event. In a survey it is an answer yes, or whatever answer is called for, triggered by a question. With Twitter we observe a public statement triggered by some event in politics as well as the way the statement is phrased. Observation via Twitter lets us determine the political phenomen that trigger the disposition to make the public statement. To what are people responding in politics is one question we can answer?
Twitter: events triggering messages
By aggregating Twitter messages for two week intervals the timeline is simplified.
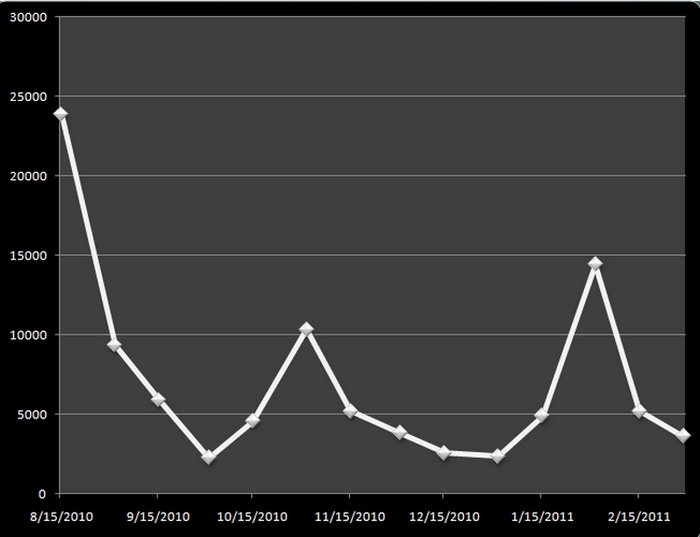 |
Obama - Muslim 8/20/10 to 3/17/11 by two week intervals |
At the "Obama-Muslim" level of abstraction the timeline shows how attention to this waxes and wanes during the period. The first two weeks 23,000 messages were posted about Obama and Muslim. That falls then rises again then falls and rises again and falls. The attention is highly variable over the seven month period. But we are not limited to this level of abstraction. We can read; they tell what the events were that precipitated the messaging.
There are three spikes. The events precipitating the spikes are easy.
On August 19, 2010 the Pew Foundation released the results from a survey they had collected earlier in the month that included the responses to a question about Obama's religion. When asked 18% said Obama is a muslim according to the release of the Pew Research Center. The news that 18% of the adult population believed Obama is a muslim became the precipitating event triggering 22,871 Twitter messages in the next two weeks. Note that Pew released its results on the 19th of August, and the data collection started the morning of the 20th. So many messages posted that first day were lost, and they would have added to the total for the first two weeks. The messages of this first two weeks were arguments being made about the results of the survey.
The Pew numbers sparked the messages, but the messages where not simply repetitions of the numbers. They included many subsidiary themes. One of these themes was about a statement by the reverend Mr. Graham. On the 19th he was interviewed by CNN and the reports of that interview produced 1,332 messages. PirateWench reported
PirateWench, RT @OTOOLEFAN: What did Franklin Graham say now? // That Obama is a Muslim because he's got the "Muslim Seed" in him from his daddy!
And POLitics said this is crazy
P0litics, @CNN This is WHY .@CNN isn't main stream news they allow propaganda words like Obama's "Muslim" seed
And Iowans made the news and were commented on:
Blog: Former Iowa Congressman Grandy sings "Obama is a Muslim"; http://tinyurl.com/25olrtq
Iowa GOP committeewoman says she believes Obama is a Muslim | Des Moines Register Staff Blogs.blogs.desmoinesregister.com
They managed to spark 146 messages. The point to notice is the ability to take the larger theme apart for further analysis.
There is one other feature of the message stream that should be noticed. One practice in Twitter messaging could be called the 'news move.' It is a statement that reports, and it most frequently includes a url. In effect the message is: did you see that xxx and here is where you can go to get more confirmation for my claim. In the first two weeks 55% of the messages contained a url to some source external to Twitter. Boyd, Golder, and Lotan (2010) found that for a sample of Twitter messages only 22% contained a url. In this two weeks and for the total collection of messages the number of messages containing a url is more than twice what is found in their sample. These Twitter messages were largely news of the day.
The second spike was during the first two weeks of November. While it contains some references to the Democrats having lost the election the primary focus was on Obama's trip to Indonesia. Indonesia was mentioned in 2,377 of the 10,339 messages. There were another 391 messages about his trip to India, and what he would do there. The trip was used by Obama to seek to improve relations with all Muslim nations. And many of the messages were about this aspect of the trip, and did not necessarily include references to the trip.
A second theme during the same period was about Sarah Palin retweeting a photo that said Obama was a Taliban Muslim. Word about this action spread quickly. Then she found herself needing to retreat from the claim, and that spurred more comments. A total of 767 of the messages were about this episode of Palin political maneuvering.
The third spike was a response to the the revolt in North Africa and specifically in Egypt. There were 15,000 messages containing Obama and Muslim during the primary two weeks of the revolt . For the most part these were not messages celebrating freedom and democracy. They were expressions of concern about the relationship between Obama and those in revolt and the possible decline of Egypt into religious fundamentalism. While religious fundamentalism is to be celebrated in the U.S. it is feared in the Muslim world. One way to illustrate the specific connection of the messages and the events in Egypt is to examine the number of messages per period that contain Muslim Brotherhood, which is the feared organization.
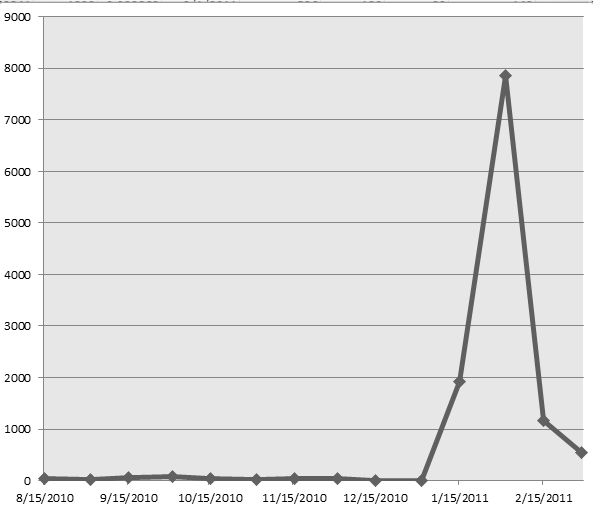 |
Messages Containing Muslim Brotherhood |
'Muslim brotherhood' is almost completely missing from the messages until revolt begins in Tunisia and Egypt. Muslim Brotherhood is mentioned 1,900 times in the second two weeks of January. It peaked in the first weeks of February when it is mentioned 7863 times. The second half of February it fell to 1169 messages. They wrote that Obama invited the Muslim Brotherhood to his speech earlier in Egypt; denial did not slow down the messages. The Muslim Brotherhood was going to take over Egypt and impose Sharia law, they said.
One more illustration of the ability to track response to political events -- Fox News' Hannity conducted a Republican focus group in Iowa. Iowa is first in the nation and learning what Iowans think could be important. One of the findings was that forty percent of the participants believed Obama is a Muslim. That precipitated 646 Twitter messages calling attention to this event.
The overall point is that one can look at how political events -- whether large or small -- are becoming part of the communication about politics. One can work through these messages at various layers of specificity depending on one's interests. Notice how this is different from observation with surveys. Most of us cannot afford daily survey tracking. When surveys are conducted the investigators write the questions. The population does not get to tell investigators what questions to ask. There are advantages to both procedures of observation. But they are different. By observing messaging with Twitter one can easily tap what is commanding attention at the moment.
Twitter: reach
The advantage of broadcast media has been the ability to reach large audiences with a single message. Politicians have adapted to this by spending the majority of their campaign funds purchasing advertising on television. The reason for doing that is the need to reach as large an audience as possible.
There are two popular ways to find messages flowing through Twitter. One is to search, which is how we observe the flow. The preferred method is following. Twitter permits any user to self-subscribe, that is, become a follower of any other person with a Twitter account. When you follow someone you receive every message they write. At the moment the Twitter follower stars are Lady Gaga in the entertainment world with 9.1 million followers [March 28, 2011]. Barak Obama is the star of the politics world with 7.2 million followers. Every message that Obama has posted to Twitter is immediately available to 7.2 million people who have volunteered to read what he has to say. That is pretty good reach. Of course, there is only one star of this magnitude. Everyone else has many fewer followers.
A research and consulting firm, Sysomos, took a sample of Twitter messages in late 2010, and they counted the number of followers found for that sample.
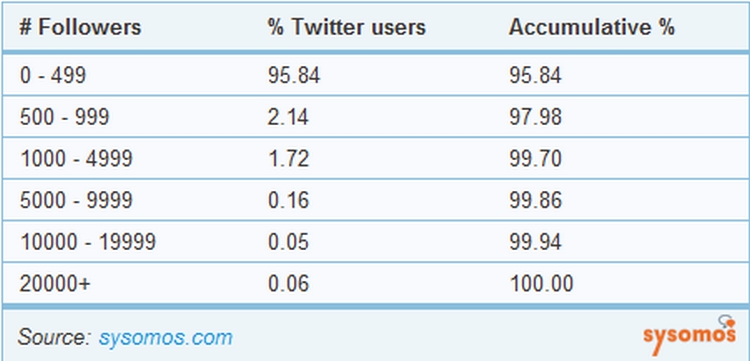 |
The overwhelming majority of Twitter users have fewer than 500 followers, and many have many fewer followers. Ninety-eight percent have fewer and 1,000 followers. And only 0.06% have 20,000 or more followers. A feature of streams about politics is that the average number of followers is almost always over 1,000. Political messaging is in this respect, as well as many others, quite different from 'normal' Twitter messaging. We collected information on the number of followers of persons tweeting about Obama Muslim for a very briet time -- March 16 through March 28, 2011. In that 12 day period 3,122 persons posted a message that contained both Obama and Muslim. Those messages reached an audience of 4,929,100. There is a modest amount of redundancy in the readership/audience numbers because some people sent more than one message. However, even when you take that out you still get something over 1,000 followers/readers per message sent. If you use that number for the two week period when there were 23,000 messages the readership was 23 million or more. That begins to be reach approximating TV reach. It is not one broadcast. But the reach in a two week period can be quite impressive.
To demonstrate that this is not a result limited to Obama Muslim the following table gives the same counts for the leading candidates for the Republican presidential nomination beginning in January of 2011 and running through the end of March.
Candidate |
Persons Messaging |
Reach |
Average |
| Bachmann* | 5,964 |
13,423,084 |
2250 |
| Gingrich | 5,839 |
13,616,237 |
2331 |
| Huckabee | 5,614 |
6,408,904 |
1141 |
| Palin* | 5,042 |
7,112,425 |
1410 |
| Paul | 4,498 |
5,990,070 |
1331 |
| Romney | 5,179 |
8,620,889 |
1664 |
| BarackObama* | 6,611 |
13,887,628 |
2100 |
The number of readers/followers ranges from 1141 for Huckabee to 2331 for Gingrich. There are several caveats about this table. Bachmann did not get into the race until later in January so these numbers are only for February and March. This is a substantial underestimate for Palin because of a peculiarity in the system collecting the messages that only has an impact on the numbers for her. And the search for BarackObama only gets BarackObama. It does not get Obama nor does it get Barack Obama. There is a reason for doing the collecting this way that is not relevant here.
There is one other important point about the table. The messages may be criticism/negative as well as positive. These are messages about the candidates. During this period Bachmann and Gingrich have been particularly targeted by people who do not like them, but there are negative as well as positive messages about each candidate.
Even so, it is clear that 1,000 followers per message is standard for this messaging. One might anticipate that the number of Twitter messages about the candidates will increase dramatically as the campaign leaves 'early skirmish' for a more active and more involving campaign.
The point is reach. TV has reach. It has not been clear that Twitter messages have reach. But for messages about politics the reach is quite substantial. It is not at all difficult to imagine the reach of twitter messages exceeding the reach of TV in some instances.
Twitter: multiple opportunities for research
If you want to know what is 'bugging' people about politics at the moment Twitter is a valuable tool. But that is hardly the only research that political scientists are concerned about.
Imagine that you wanted to do the psychopathology of a political movement. The text is there; the language is there. How they address issues and each other is there. What they can and cannot learn is there. Lasswell gave us psychopathology and politics. We have the foundation for pursuing it. The procedure is using content analysis to bring together the raw language in to a coherent account. Kivran-Swaine and Mor did not do exactly this, but they did research using a dictionary regularly used by psychologists to investigate the sharing of emotions among people following each other on Twitter [Kivran-Swaine, Funda and Naaman, Mor, 2011]. Their work uses the text that is publicly available to develop an account of social and emotional interaction in Twitter communication.
How do members of congress use Twitter to communicate with their constituents? [Boynton, 2010] There is at least one paper asking this question at this meeting. One can also move this research to elections. The table on reach would be a partial answer to questions about twitter messages about the candidates.
Twitter: wrap up
It starts with Obama Muslin. The messages are poring out by the thousands. Observing the communication about this political mood by collecting Twitter messages provides a means of discovering how much communication is going on, what events are triggering the variation in the flow of messages, and can become the basis for examining the emotional state in the stream of messages. We are also able to assess the reach of these messages -- how many people are reading the messages as followers of the people writing them. For this paper we looked at triggering events and reach to show one type of research that this mode of observation makes possible.
Survey Research
Survey research can be used to answer questions that cannot be studied easily with Twitter. For Twitter messages the observer knows very little about most of the persons posting them. The messages are public. The characteristics of the people are not. And that is what survey research is particularly good at -- relating the various characteristics of the respondents to understand some elements of what leads them to act as they do.
Survey Research: population distributions
They are 'sample' surveys. That makes it possible to estimate distributions in the population with a given margin of error. How many people answer that Obama is a Muslim? Eighteen percent of the population is the answer. That is the number reached in 2010, and it appears to be stable. But a stable distribution does not account for the highly variable stream of communications about Obama and Muslim. By having these two observations we know we need conceptual understanding that can cope with both stability and variation. That is not really a measurement problem. Instead it is a conceptual problem for differentiating the people who answer a question and nothing more from the people who would answer the question the same way, but would also be triggered to communicate by events of the day.
Survey Research: Who?
Who are the people who respond yes, Obama is a Muslim? Social division leads to thinking evil of the other. Being a Muslim is clearly understood as evil or something close to it by the people who believe Obama is Muslim. We do not get that from the survey, but any reading of the messages gives that conclusion. The current 'sides' are Democrats and Republicans, or Liberals and Conservatives. We should find partisanship and ideology are closely connected to believing Obama is Muslim.
The results are about what one would expect.
Obama Religion by Party |
Obama Religion by Ideology |
||||||
Muslim |
DK |
Other |
Muslim |
DK |
Other |
||
| Rep | 46.9 |
26.1 |
16.4 |
Cnsv | 71.6 |
53.0 |
28.9 |
| Ind | 36.5 |
42.0 |
41.0 |
Mod | 20.9 |
26.7 |
36.7 |
| Dem | 16.6 |
31.8 |
42.5 |
Lib | 7.4 |
20.2 |
34.4 |
100% |
100% |
100% |
100% |
100% |
100% |
||
Half of the respondents who say Obama is a Muslim are Republicans, and the other half is split between independents and Democrats with Democrats constituting only 16.6%. Only sixteen percent of those who said Obama practiced some other religion were Republicans, and the remaining eighty percent were split between independents and Democrats. The distribution by ideology is more extreme in who makes up those who believe Obama is a muslim with 71.6% being conservatives. But those who said other are somewhat more evenly split than the case for partisanship.
People who are using Twitter to communicate about politics are surely very active politically. The measure of political activity interacts with partisanship in a revealing way.
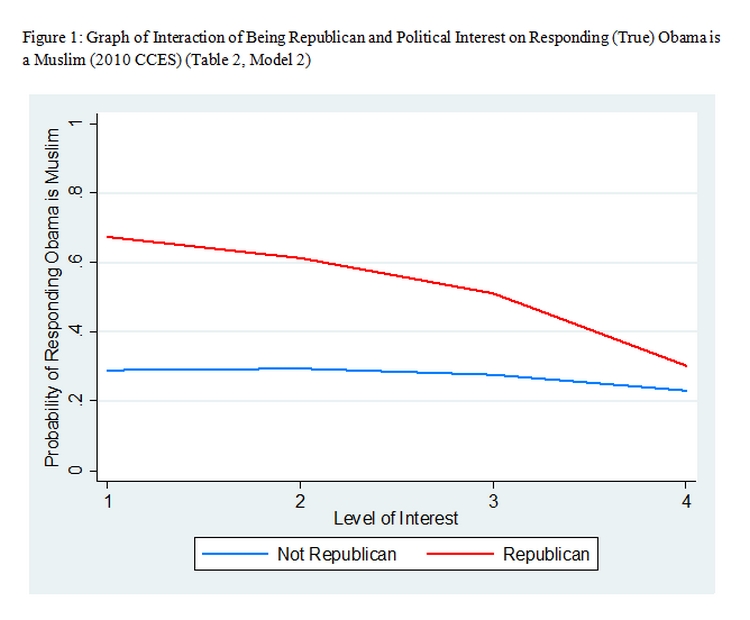 |
The y axis is the probability of responding that Obama is a Muslim. The x axis is level of interest ranging from low to high. And the figure plots the probability of responding that Obama is a Muslim by partisanship. Those who are not Republicans have a probability of just over 20%, and that does not change with level of interest in politics. Level of interest in politics makes a considerable difference for Republicans. Those with the lowest level of interest have a somewhat more than 60% probability of saying Obama is a Muslim while those with the greatest interest in politics are down to about 30% likely to say Obama is a Muslim.
That is an interesting finding. The Republicans who are not very interested in politics are most likely to believe Obama is a Muslim, and the probability declines as interest in politics increases. Interesting! However, it produces a conundrum. People who are using Twitter to communicate about this are most certainly people with a high interest in politics. The positive relationship between level of interest and political activity has been firmly established. So the people tweeting have to be largely drawn from those Republicans who are least likely to say Obama is a Muslim.
Survey research: our conumdra
Looking at the Twitter and survey data we know there is both stability and variability in the observations. Answering the questions yes seems to be at a stable state. But the number of Twitter messages changes rather dramatically over time.
Using the survey data we find that the people most likely to be using Twitter to communicate are drawn from a population of Republicans which is, for Republicans, least likely to believe Obama is a Muslim.
Back to psychopathology and politics or something like that. The surveys contained a standard battery of psychological tests. Once you control for everything else, which includes partisanship and interest in politics, three of the tests are significantly related to saying Obama is a Muslim. And they help understand how both conundra can be understood as apparent conundra.
One of the tests measures extraversion. People who are high on the extraversion scale are more likely to say Obama is a Muslim. But people who are high on an extraversion scale are also more likely to engage in communication including using Twitter. We can assume that extraversion is a constant and thus does not change the distribution of yes in the population. But people high in extraversion are just the kind of people one would expect to be communicating actively when triggered by events -- giving variability in Twitter messages over time.
People who said Obama is a Muslim are high on the conscientiousness scale. People who believe Obama is a Muslim, have a high interest in politics, and are conscientious about, in this case politics, are just the people who are likely to feel that they should express their views. Note that these are just the people who are likely to be Republicans and have a high interest in politics. They may be relatively few in number, but they are going to feel they should speak out.
The third scale is neuroticism. People high on the neuroticism scale are more likely than others, all evidence notwithstanding, to believe that Obama is a Muslim.
Observations
Scientific understanding is based on ideas and careful observations. We have been using survey research for decades. It has real strengths for estimating distributions in large populations and for connecting various elements into a coherent account. But we know communication is important in politics. How else, for example, would we learn the positions and character of candidates other than in communication. And survey research is not good at tapping communication except the communication between question and answer. Suddenly Twitter appears on the scene, and there are 50 billion messages a week. And lots of them are about politics. If we are equally systematic with our observation of this communication as we have been with survey research a very large realm of human affairs is opened to us. And they can work together.
References
Boyd, Golder, and Lotan (2010) "Tweet, Tweet, Retweet: Conversional Aspects of retweeting on Twitter," hicss, pp. 1-10, 2010 43rd Hawaii International Conference on System Sciences,2010.
Boynton (2011) RT @bobboynton new media and the revolting middle east, paper presented at the 2011 ISA meeting.
Boynton (2010) Opinion Leadership From Inside the Beltway, paper presented at the 2010 meeting of the American Political Science Association.
Funda Kivran-Swaine and Mor Naaman Network Properties and Social Sharing of Emotions in
Social Awareness Streams
CSCW 2011, March 19–23, 2011, Hangzhou, China.
Copyright 2011 ACM 978-1-4503-0556-3/11/03
Our Survey Data
This paper utilizes two datasets to explore perceptions of Obama’s religion. These datasets are both national samples and conducted during important election cycles, 2008 presidential election and 2010 congressional election. Estimating models using both datasets allows for replication and comparison across samples and time periods. Because significant proportions of respondents indicate “don’t know” when queried about Obama’s religion, and studies suggest non-answers may mask true opinions (Berinsky), all of the regression models are estimated using multinomial logits (Obama Muslim, don’t know, or other religion) with survey weights to make the samples representative of American voter registered population.
2010 CCES
The first dataset we utilize for the analyses is the 2010 Cooperative Congressional Election Study (CCES), a pre- and post-election nationally stratified panel survey. The full sample consists of 55,000 American adults. Each team of researchers participating in the 2010 CCES panel survey also designed a module of questions for a sample of approximately 1,000 respondents. It is only these 1,000 respondents that received the questions asking for their views on Obama’s religion; our analyses use this subsample.
From the CCES data we create two dependent variables that measure respondents opinions of Obama’s religion. The first dependent variable is created from an open-ended question which asks respondents what religion they believe Obama is. Using this we create a 3-point categorical variable; the variable takes the value of 1 if respondent said Obama was a religion that was not Muslim, 2 if they said they didn’t know what religion he was, and 3 if they said he was Muslim. The second dependent variable utilizes a question that asks respondents if it is true or false that Obama is a practicing Muslim. From this question we create a 3-point categorical variable; the variable takes the value of 1 if respondent said false (i.e. he is not a practicing Muslim), 2 if they said they didn’t know, and 3 if they said true (i.e. he is a practicing Muslim).
We include many explanatory variables in the model, all measured at the individual level. First, we include measures of the respondent’s religion. This includes two variables, if the respondent is an evangelical Christian, and an index of how frequently they engage in religious behaviors (Smidt, Kellstedt, and Guth 2009). A third variable (amount religion guides daily life) is usually included for a complete measure of a respondent’s religion; however, this variable is not available in the CCES. All other variables are measured through self-report, full information and coding is presented in the Appendix.
2008 CCAP
The second dataset is the 2008 Cooperative Comparative Analysis Project (CCAP) six-wave nationally representative panel survey (Jackman and Vavreck 2009). The six waves of this survey were conducted before and after the 2008 election, approximately 14,000 respondents completed all six waves. The CCAP has a common battery of questions comparable to the American National Election Survey (ANES), but with sample sizes many times larger than these other omnibus surveys. The large sample size allows sufficient cases to test our theory, and allows for replication and comparison to the models created using the 2010 CCES data.
Our primary question involves understanding American’s perceptions of Obama’s religion. To study this, we create a dependent variable from a question asking respondents to name Obama’s religion. From this we create a 3-point categorical variable; the variable takes the value of 1 if respondent said Obama was a religion that was not Muslim, 2 if they said they didn’t know what religion he was, and 3 if they said he was Muslim.
The CCAP models mirror the CCES models, and include all of the same explanatory variables in the models. One difference is the measure of frequency of religious practices, the CCAP only includes frequency of church attendance so this variable is used. In addition to these variables, the CCAP also includes the Ten-Item Personality Inventory (TIPI), including personality in our model gives us more in-depth measures of differences between individuals (see Mondak and Halperin 2008). The TIPI consists of five personality traits, each measured with two attributes, one at either end of the trait spectrum: Extraversion (enthusiastic, reserved), Openness to Experience (complex, conventional), Conscientiousness (dependable, careless), Agreeableness (critical, sympathetic), and Neuroticism (anxious, calm; often presented as its inverse Emotional Stability). For complete coding for all variables in the analyses, see Appendix.
2010 Cooperative Congressional Election Study (CCES)
Table 1a: Wording, What religion is Obama?
N=842 |
Percentage who answered: |
Other religion |
53.39% |
Muslim |
16.96% |
Don’t know |
29.64% |
Table 1b: Wording, What religion is Obama? By Party ID
N=827 |
Democrat |
Republican |
Independent |
Total |
Other religion |
42.53% |
16.43% |
41.04% |
100% |
Muslim |
16.56% |
46.96% |
36.48% |
100% |
Don’t know |
31.81% |
26.14% |
42.05% |
100% |
Table 1c: Wording, What religion is Obama? By Ideology
|
Liberal |
Conservative |
Moderate |
Total |
Other religion |
34.41% |
28.89% |
36.70% |
100% |
Muslim |
7.40% |
71.62% |
20.98% |
100% |
Don’t know |
20.24% |
53.01% |
26.75% |
100% |
Table 2a: Wording, True or False Obama is a practicing Muslim?
N=1000 |
Percentage who answered: |
False |
28.69% |
True |
27.99% |
Don’t know |
43.33% |
Table 2b: Wording, True or False Obama is a practicing Muslim? By Party ID
|
Democrat |
Republican |
Independent |
Total |
False |
55.63% |
11.99% |
32.38% |
100% |
True |
16.21% |
43.20% |
40.58% |
100% |
Don’t know |
35.57% |
23.65% |
40.78% |
100% |
Table 2c: Wording, True or False Obama is a practicing Muslim? By Ideology
|
Liberal |
Conservative |
Moderate |
Total |
False |
41.61% |
21.14% |
37.24% |
100% |
True |
11.31% |
64.37% |
24.32% |
100% |
Don’t know |
22.27% |
47.67% |
30.05% |
100% |
2008 Cooperative Campaign Analysis Project (CCAP)
Table 3a: Wording, is Obama Muslim (or other religion = no)?
N=1000 |
Percentage who answered: |
No |
63.20% |
Yes |
18.10% |
Don’t know |
18.70% |
Table 3b: Wording, is Obama Muslim (or other religion = no)? by Party ID
|
Democrat |
Republican |
Independent |
Total |
No |
58.03% |
30.13% |
11.84% |
100% |
Yes |
19.72% |
67.68% |
12.59% |
100% |
Don’t know |
39.73% |
42.00% |
18.27% |
100% |
Table 3b: Wording, is Obama Muslim (or other religion = no)? by Ideology
|
Liberal |
Conservative |
Moderate |
Total |
No |
32.87% |
29.84% |
37.29% |
100% |
Yes |
7.15% |
67.68% |
25.16% |
100% |
Don’t know |
14.53% |
52.95% |
32.52% |
100% |
Table 1: Multinomial Logit Regression of Obama’s Religion as Muslim (2010 CCES)
Model 1 |
Model 2 |
Model 3 |
||||
Don’t know vs. other religion |
Coef. |
P-Value |
Coef. |
P-Value |
Coef. |
P-Value |
Evangelical |
0.17 |
0.615 |
0.23 |
0.518 |
0.17 |
0.612 |
Religious Behavior |
0.07 |
0.468 |
0.07 |
0.464 |
0.07 |
0.469 |
Political Interest |
-0.78 |
0.000 |
-0.70 |
0.000 |
-0.78 |
0.001 |
Liberal |
0.01 |
0.975 |
0.01 |
0.985 |
0.01 |
0.976 |
Conservative |
1.13 |
0.003 |
1.10 |
0.004 |
1.17 |
0.341 |
Conservative* |
|
|
-0.01 |
0.966 |
||
Democrat |
-0.35 |
0.344 |
-0.37 |
0.321 |
-0.36 |
0.352 |
Republican |
0.17 |
0.651 |
1.52 |
0.423 |
0.16 |
0.653 |
Republican* |
-0.40 |
0.428 |
|
|
||
Black |
-0.24 |
0.646 |
-0.23 |
0.651 |
-0.24 |
0.645 |
Hispanic |
0.48 |
0.413 |
0.51 |
0.380 |
0.48 |
0.413 |
Asian |
-0.79 |
0.446 |
-0.80 |
0.431 |
-0.79 |
0.448 |
-0.30 |
0.069 |
-0.30 |
0.066 |
-0.30 |
0.067 |
|
Education |
-0.10 |
0.499 |
-0.11 |
0.468 |
-0.10 |
0.499 |
Female |
0.10 |
0.734 |
0.09 |
0.771 |
0.10 |
0.734 |
Married |
0.08 |
0.806 |
0.07 |
0.816 |
0.08 |
0.804 |
Age |
0.01 |
0.471 |
0.01 |
0.476 |
0.01 |
0.468 |
Constant |
1.55 |
0.099 |
1.34 |
0.177 |
1.54 |
0.128 |
Muslim vs. other religion |
|
|
|
|
||
Evangelical |
0.33 |
0.403 |
0.35 |
0.366 |
0.33 |
0.388 |
Religious Behavior |
0.05 |
0.659 |
0.05 |
0.657 |
0.05 |
0.659 |
Political Interest |
-0.54 |
0.071 |
-0.50 |
0.166 |
-0.54 |
0.145 |
Liberal |
-0.56 |
0.432 |
-0.57 |
0.425 |
-0.56 |
0.434 |
Conservative |
1.17 |
0.008 |
1.15 |
0.008 |
1.14 |
0.526 |
Conservative* |
|
|
0.01 |
0.982 |
||
Democrat |
-0.83 |
0.061 |
-0.84 |
0.057 |
-0.83 |
0.068 |
Republican |
0.55 |
0.193 |
1.45 |
0.495 |
0.56 |
0.196 |
Republican* |
-0.25 |
0.656 |
|
|
||
Black |
-0.11 |
0.920 |
-0.10 |
0.921 |
-0.11 |
0.920 |
Hispanic |
0.08 |
0.888 |
0.09 |
0.873 |
0.08 |
0.887 |
Asian |
-0.90 |
0.485 |
-0.93 |
0.467 |
-0.90 |
0.490 |
Income |
-0.38 |
0.049 |
-0.38 |
0.045 |
-0.38 |
0.052 |
Education |
-0.64 |
0.000 |
-0.64 |
0.000 |
-0.64 |
0.000 |
Female |
-0.31 |
0.360 |
-0.31 |
0.357 |
-0.30 |
0.374 |
Married |
0.06 |
0.881 |
0.05 |
0.886 |
0.05 |
0.880 |
Age |
0.02 |
0.147 |
0.02 |
0.147 |
0.02 |
0.146 |
Constant |
1.28 |
0.260 |
1.16 |
0.332 |
1.30 |
0.272 |
Pseudo-R2 |
0.164 |
0.165 |
|
0.164 |
|
|
Wald χ2 |
96.07 |
96.32 |
|
98.81 |
|
|
N |
791 |
791 |
|
791 |
|
|
Note: Dependent variable is 3-point categorical variable, Obama is another religion (not Muslim), don’t know, Obama is Muslim; reference category is other religion (not Muslim). Unstandardized multinomial logit coefficients with robust standard errors in parentheses. All probabilities based on two-tailed tests.
Table 2: Multinomial Logit of (True/False) Is Obama a Muslim (2010 CCES)
Model 1 |
Model 2 |
Model 3 |
||||
Don’t Know vs. False |
Coef. |
P-Value |
Coef. |
P-Value |
Coef. |
P-Value |
Evangelical |
-0.15 |
0.668 |
-0.14 |
0.682 |
-0.13 |
0.708 |
Religious Behavior |
-0.09 |
0.373 |
-0.09 |
0.363 |
-0.09 |
0.379 |
Political Interest |
-0.82 |
0.000 |
-0.79 |
0.000 |
-0.76 |
0.000 |
Liberal |
-0.01 |
0.972 |
-0.03 |
0.939 |
-0.03 |
0.931 |
Conservative |
1.32 |
0.000 |
1.32 |
0.000 |
1.49 |
0.349 |
Conservative* |
|
|
-0.08 |
0.851 |
||
Democrat |
-0.30 |
0.400 |
-0.29 |
0.416 |
-0.34 |
0.347 |
Republican |
0.20 |
0.582 |
3.80 |
0.187 |
0.19 |
0.598 |
Republican* |
-0.92 |
0.212 |
|
|
||
Black |
-0.44 |
0.414 |
-0.45 |
0.404 |
-0.43 |
0.419 |
Hispanic |
0.52 |
0.229 |
0.52 |
0.227 |
0.51 |
0.233 |
Asian |
0.56 |
0.388 |
0.47 |
0.490 |
0.56 |
0.390 |
Income |
-0.19 |
0.233 |
-0.19 |
0.242 |
-0.20 |
0.207 |
Education |
-0.17 |
0.242 |
-0.16 |
0.266 |
-0.17 |
0.239 |
Female |
-0.04 |
0.888 |
-0.04 |
0.893 |
-0.04 |
0.869 |
Married |
-0.22 |
0.435 |
-0.23 |
0.418 |
-0.21 |
0.463 |
Age |
0.00 |
0.620 |
-0.01 |
0.577 |
0.00 |
0.629 |
Constant |
4.05 |
0.00 |
3.95 |
0.000 |
3.95 |
0.000 |
True (Muslim) vs. False |
|
|
|
|
||
Evangelical |
-0.01 |
0.973 |
0.06 |
0.859 |
-0.05 |
0.891 |
Religious Behavior |
-0.20 |
0.056 |
-0.20 |
0.052 |
-0.20 |
0.059 |
Political Interest |
-0.78 |
0.002 |
-0.62 |
0.034 |
-0.95 |
0.001 |
Liberal |
-0.33 |
0.457 |
-0.36 |
0.419 |
-0.33 |
0.467 |
Conservative |
1.26 |
0.001 |
1.20 |
0.001 |
-0.09 |
0.959 |
Conservative* |
|
|
0.41 |
0.377 |
||
Democrat |
-1.03 |
0.010 |
-1.04 |
0.009 |
-0.96 |
0.019 |
Republican |
0.74 |
0.044 |
5.68 |
0.053 |
0.76 |
0.039 |
Republican* |
-1.32 |
0.080 |
|
|
||
Black |
-0.31 |
0.635 |
-0.30 |
0.641 |
-0.33 |
0.630 |
Hispanic |
0.13 |
0.788 |
0.13 |
0.797 |
0.14 |
0.780 |
Asian |
-1.23 |
0.213 |
-1.36 |
0.126 |
-1.29 |
0.192 |
Income |
-0.33 |
0.064 |
-0.33 |
0.062 |
-0.32 |
0.081 |
Education |
-0.27 |
0.038 |
-0.28 |
0.033 |
-0.27 |
0.042 |
Female |
-0.09 |
0.781 |
-0.10 |
0.745 |
-0.07 |
0.820 |
Married |
-0.05 |
0.882 |
-0.05 |
0.861 |
-0.07 |
0.811 |
Age |
0.00 |
0.954 |
0.00 |
0.989 |
0.00 |
0.949 |
Constant |
4.55 |
0.00 |
4.10 |
0.001 |
4.99 |
0.000 |
Pseudo-R2 |
0.156 |
0.160 |
|
0.159 |
|
|
Wald χ2 |
128.52 |
119.67 |
|
133.39 |
|
|
N |
927 |
927 |
|
927 |
|
|
Note: Dependent variable is 3-point categorical variable, Obama is not Muslim (False), don’t know, Obama is Muslim (True); reference category is not Muslim (False). Unstandardized multinomial logit coefficients with robust standard errors in parentheses. All probabilities based on two-tailed tests.
*Higher information Republicans less likely to think Obama is a Muslim using 2010 data. Not true for conservatives though.
Table 3: Multinomial Logit of Obama’s Religion as Muslim, including controls for Personality Dispositions (2008 Cooperative Campaign Analysis Project)
Model 1 |
Model 2 |
|||
Don’t know vs. other religion |
Coef. |
P-Value |
Coef. |
P-Value |
Evangelical |
0.14 |
0.164 |
0.13 |
0.184 |
Church Attendance |
-0.04 |
0.012 |
-0.04 |
0.020 |
Political Interest |
-1.05 |
0.000 |
-1.02 |
0.000 |
Liberal |
-0.31 |
0.026 |
-0.31 |
0.023 |
Conservative |
0.94 |
0.000 |
0.93 |
0.000 |
Democrat |
-0.29 |
0.022 |
-0.32 |
0.012 |
Republican |
0.27 |
0.011 |
0.24 |
0.021 |
Black |
-0.23 |
0.186 |
-0.24 |
0.184 |
Hispanic |
0.22 |
0.167 |
0.23 |
0.150 |
Asian |
0.89 |
0.011 |
0.92 |
0.008 |
Income |
-0.05 |
0.000 |
-0.05 |
0.000 |
Education |
-0.22 |
0.000 |
-0.21 |
0.000 |
Female |
0.26 |
0.002 |
0.24 |
0.007 |
Married |
0.24 |
0.010 |
0.24 |
0.012 |
Age |
0.00 |
0.922 |
0.00 |
0.852 |
Extraversion |
0.07 |
0.176 |
||
Agreeableness |
0.03 |
0.518 |
||
Conscientiousness |
0.02 |
0.631 |
||
Neuroticism |
0.09 |
0.007 |
||
Openness to Experience |
-0.06 |
0.087 |
||
Constant |
-0.35 |
0.149 |
-0.06 |
0.875 |
Obama Muslim vs. other religion |
|
|
||
Evangelical |
0.11 |
0.240 |
0.12 |
0.237 |
Church Attendance |
0.02 |
0.266 |
0.02 |
0.271 |
Political Interest |
-0.84 |
0.000 |
-0.83 |
0.000 |
Liberal |
-0.51 |
0.004 |
-0.49 |
0.007 |
Conservative |
0.92 |
0.000 |
0.94 |
0.000 |
Democrat |
-0.93 |
0.000 |
-0.98 |
0.000 |
Republican |
0.50 |
0.000 |
0.48 |
0.000 |
Black |
-1.23 |
0.000 |
-1.19 |
0.000 |
Hispanic |
0.07 |
0.664 |
0.04 |
0.817 |
Asian |
-0.02 |
0.959 |
0.01 |
0.982 |
Income |
-0.04 |
0.001 |
-0.05 |
0.001 |
Education |
-0.36 |
0.000 |
-0.35 |
0.000 |
Female |
0.24 |
0.004 |
0.21 |
0.015 |
Married |
0.24 |
0.012 |
0.21 |
0.031 |
Age |
0.00 |
0.097 |
0.00 |
0.122 |
Extraversion |
0.15 |
0.002 |
||
Agreeableness |
0.05 |
0.262 |
||
Conscientiousness |
0.08 |
0.064 |
||
Neuroticism |
0.15 |
0.000 |
||
Openness to Experience |
-0.02 |
0.560 |
||
Constant |
-0.27 |
0.262 |
-0.63 |
0.120 |
Pseudo-R2 |
0.158 |
0.161 |
|
|
Wald χ2 |
1166.28 |
1193.33 |
|
|
N |
9855 |
9766 |
|
|
Note: Dependent variable is 3-point categorical variable, Obama is another religion (not Muslim), don’t know, Obama is Muslim; reference category is other religion (not Muslim). Unstandardized multinomial logit coefficients with robust standard errors in parentheses. All probabilities based on two-tailed tests.