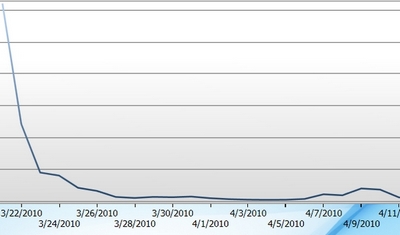
Tweets about Bart Stupak
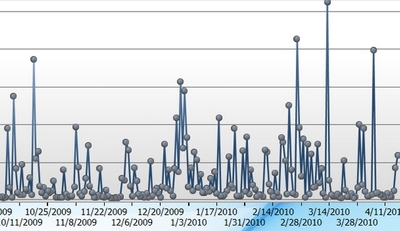
Tweets about suicide attacks
Assessing Volatility
The number of tweets about a subject bounces up and down from day to day. Here are two examples:
Tweets about Bart Stupak |
Tweets about suicide attacks |
|
|
It is very hard not to think that there is more volatility in the image of tweets per day about suicide attacks than about Bart Stupak. But it is not obvious how to specify the volatility and how to summarize it so we can say a bit more precisely -- this is more volatile than that.
A more plausible comparison is the tweets about Sarah Palin [#palin] and the Teaparty [#teaparty]. Below is a picture of a spreadsheet that summarizes the operations I went through to find an acceptable way to do both.
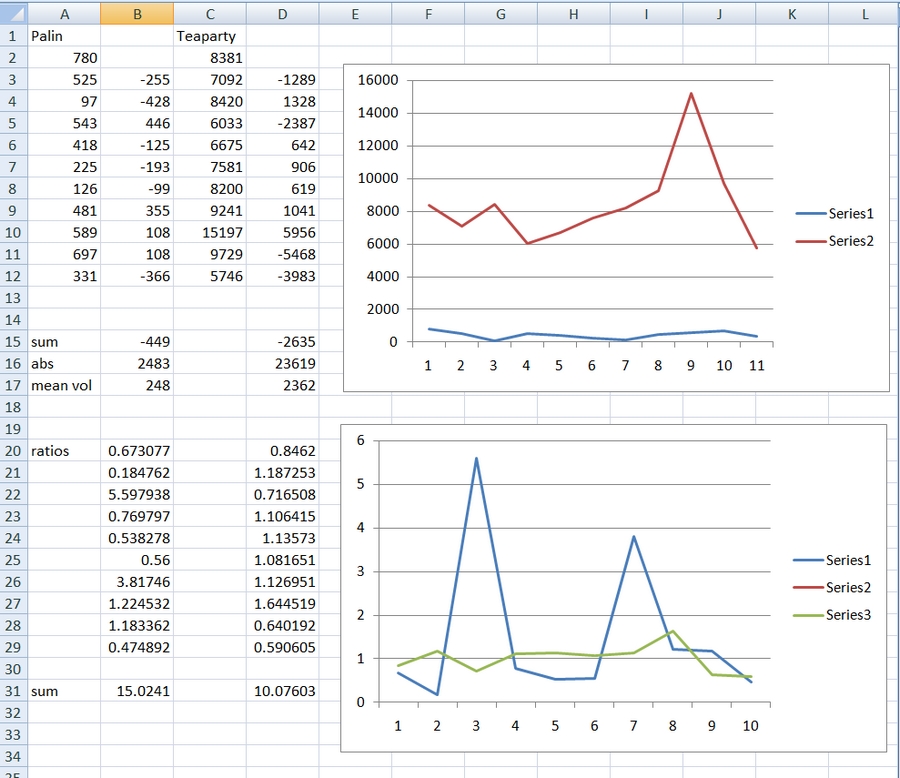 |
The figure with series1 and series2 is the raw numbers. It makes clear that the two are on very different scales. There are roughly 10 times as many tweets about #teaparty as about #palin.
One way to proceed is to examine the differences; subtact the value at time 1 from the value at time 2, iterate as many times as you have data points, and summarize. There are 11 data points in the first and third columns. If you do the first differences you get columns 2 and 4. The sum of the absolute values is 2483 for #palin and 23619 for #teaparty. Since there are now 10 data points computing the mean is very simple. The mean for #teaparty is approximately 10 times the mean for #palin. Does that mean there is more volatility for #teaparty or does that mean the difference is a function of the differences in scale. Using this computation one would almost always come to the result that there was more volatility in a string of large numbers than in a string of small numbers. That does not seem a very satisfactory result.
One alternative to simple first differences would be to standardize the values of the two strings of numbers first -- mean of 0 and standard deviation of 1. Then you could take the first differences. I have three problems with this. One, the transformation is based on the assumption of a normal distribution. That is not an assumption that will be met regularly with these strings of numbers. Two, the transformation is based on the assumption that the mean is stationary -- it is not moving around in the string. Since many strings look like they change means in time that does not seem a very good assumption. Three, call it transparency [that is a good word these days] it is hard to imagine yourself back from the standardized numbers to the raw numbers with which you started. That seems important to me. We ought to know what we are doing.
So, I tried ratios. What if you thought the volatility of a change from 2 to 6 was the same as from 20 to 60? In both cases the second number is three times as large as the first number. The difference in scale immediately goes away. After looking at these numbers for many hours I decided that that is what volatility means to me -- at least until someone persuades me otherwise. So divide value at time 2 by value at time 1 and iterate for as many data points as you have. That produced the columns B20 through B29 and D20 through D29. With ratios there are no negative numbers so you can sum the numbers and you find that the volatility of #palin is 15.0 and the volatility of #teaparty is 10.1. The figure beside the two columns illustrates the amount of bouncing in the two series where bouncing is about ratios. Obviously Series1 [#palin] is doing much bigger bounces than is Series3 [#teaparty]. The result is just the opposite of the first computational procedure. One also might want to do standard deviations, but that seems pointless with 10 numbers.
Ratios are 'funny' numbers. The minimum is not 0. Instead the minimum is 1 since no volatility would mean no change from time 1 to time 2, that would mean dividing the second number by itself [no change], and any number divided by itself is 1. If the mean for a string is 1, which it is for #teaparty, then you would need to compute something like the standard deviation to show that there was change going on.
And the question is -- are there more problems that I do not recognize when using ratios as a way of specifying volatility?
© G. R. Boynton, 2010
April 17, 2010