#twitterfacts is discovered
I started following politics on twitter in August of 2009. In the first year I followed 200 streams of messages as well as messages to and from about 200 members of congress. In March of 2010 I decided that a very brief message posted to twitter would be one way to share what I was learning. Thus, #twitterfacts was born. #twitterfacts are twitter messages with all the constraints that follow. They are brief messages about counts that seem interesting to me. One of the first was:
Early in March there was a terrible earthquake in Chile. This is the count of twitter messages for the first days after the earthquake. Eventually there were more than 200,000 messages, mostly condolences, about the string of earthquakes Chile suffered.
Twitter is now one of the important ways people are responding to their world. It is on the spot news. It is spreading the word about an event. It is expressing -- often in rather uncivil language -- a person's feelings about something political. It is competing truths and falsehoods. It is political action with substantial import. #twitterfacts is an effort to share what I am learning about how people are messaging about politics. Two more illustrate the genre.
They are counts. Often they include comparisons as do these two. Publishing 90,000+ documents from the military effort in Afghanistan was thought to be a challenge to the war effort. But the response was not as great to that as was the response to Obama firing McChrystal. And the relative volume of messages for #teaparty and #p2 produces the surprising result that the 'left' is producing substantially more messages than is the 'right.'
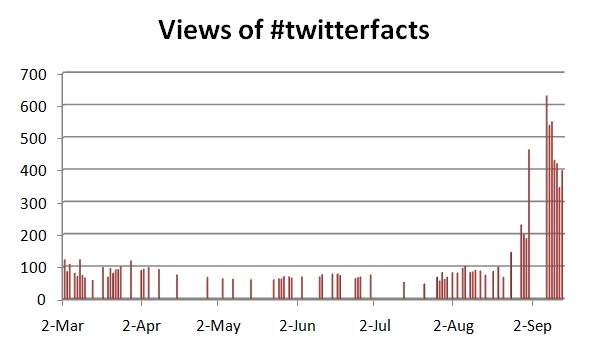
I post #twitterfacts to Posterous, which is a blog hosting system. Posterous is simple to use, and it will forward the post to twitter or other social networks. Between March 2 and September 23 I posted 90 #twitterfacts. Posterous keeps a count of views of blog posts. So, I know that for the first five months of #twitterfacts the views were modest. This is the distribution.
|
The figure shows that there were times when I was more actively posting #twitterfacts and times when I was less active. It also shows a definite take off point. Through the first three weeks of August the mean number of views was 77.7, and the standard deviation was 16. After the 21st of August views takes off. The mean is 345 with a standard deviation of 153. The low was 140, but notice that is substantially more views than for the first period. And the high is 629.
The month from the last week in August through the first three weeks of September were days of "mosque at ground zero," "Obama muslim," and "9/11." While that must have contributed very importantly to the jump in views the most viewed #twitterfacts during the month was
It is not American politics. It is not connected to the controversy surrounding 9/11. But it was viewed 629 times.
I hope this means more people are finding the information interesting and illuminating.
The url at which #twitterfacts can be found is: http://bobboynton.posterous.com/
I also do longer #twitterreports. The url at which they can be found is: http://www.boyntons.us/website/new-media/new-media.html
©G. R. Boynton, 2010
NB the counts are a moving target. These counts were as of September 23, 2010. The counts for the last month had increased about 10% between September 22 and September 23.